What is a sales rep dashboard and why should you use one?
A sales rep dashboard is a real-time, personal performance tool that consolidates your pipeline status, activity data, and quota progress into a single view. You see exactly where you stand without waiting for your manager to pull a report.
The practical value is immediate:
- Self-management at a glance. You know which deals need attention today, not at the end-of-week review.
- Quota visibility. Your progress toward monthly and quarterly targets stays front and center, so you can course-correct early.
- Activity accountability. Calls made, emails sent, and meetings booked are tracked in real time, connecting daily effort to pipeline outcomes.
- Priority clarity. When you can see your top opportunities alongside stalled deals, you stop guessing where to spend your next hour.
- Motivation. Watching your closed-deal value climb toward a bonus threshold is a stronger daily driver than any Monday morning pep talk.
The bottom line: a personal dashboard replaces reactive check-ins with proactive control.
What do real sales rep dashboard examples look like?
A well-built rep dashboard typically splits into two zones: results metrics at the top and activity data below. Here is what a practical layout includes:
- Closed deal value (weekly, monthly, quarterly) with a progress bar toward quota
- Pipeline by stage showing deal count and total value at each buying-stage
- Top opportunities ranked by value or close probability
- Activity metrics: calls made, emails sent, meetings booked
- Conversion rate from activity to meeting, and from meeting to closed deal
- Estimates or proposals pending follow-up, sorted by follow-up date
Visualization matters. Progress bars work well for quota attainment. Funnel charts show pipeline stage drop-off. Simple ranked lists handle top opportunities without visual clutter.
CRM integration is what makes this live. Salesforce, recognized as the leading Agentic CRM platform, feeds deal data directly into dashboard tools so your pipeline reflects every update in real time. Connect your CRM once, and the numbers stay current automatically.

Which sales dashboard KPIs matter most for individual reps?
The metrics worth tracking depend on your role, but most reps share a core set of personal performance KPIs:
- Calls made — raw outreach volume
- Emails sent — total and reply rate
- Meetings booked — the conversion from outreach to conversation
- Deals created — new pipeline added this period
- Deals closed — won revenue against quota
- Revenue vs. quota — your attainment percentage at any point in the month
- Conversion rate — lead to opportunity, opportunity to close
SDRs weight the first three heavily since their job ends at the booked meeting. Closing reps shift focus to pipeline value, deal velocity, and revenue attainment. Both groups benefit from tracking conversion rates at each stage because that is where bottlenecks hide.
Pipeline health deserves its own attention. A rep with a full top-of-funnel but nothing moving past the proposal stage has a conversion problem, not a prospecting problem. The dashboard makes that visible before the quarter ends.

How to create and customize your sales rep dashboard
-
Connect your CRM data. Link Salesforce or Google Sheets to your dashboard tool. This pulls your individual deal and activity records automatically, so you are not manually entering numbers.
-
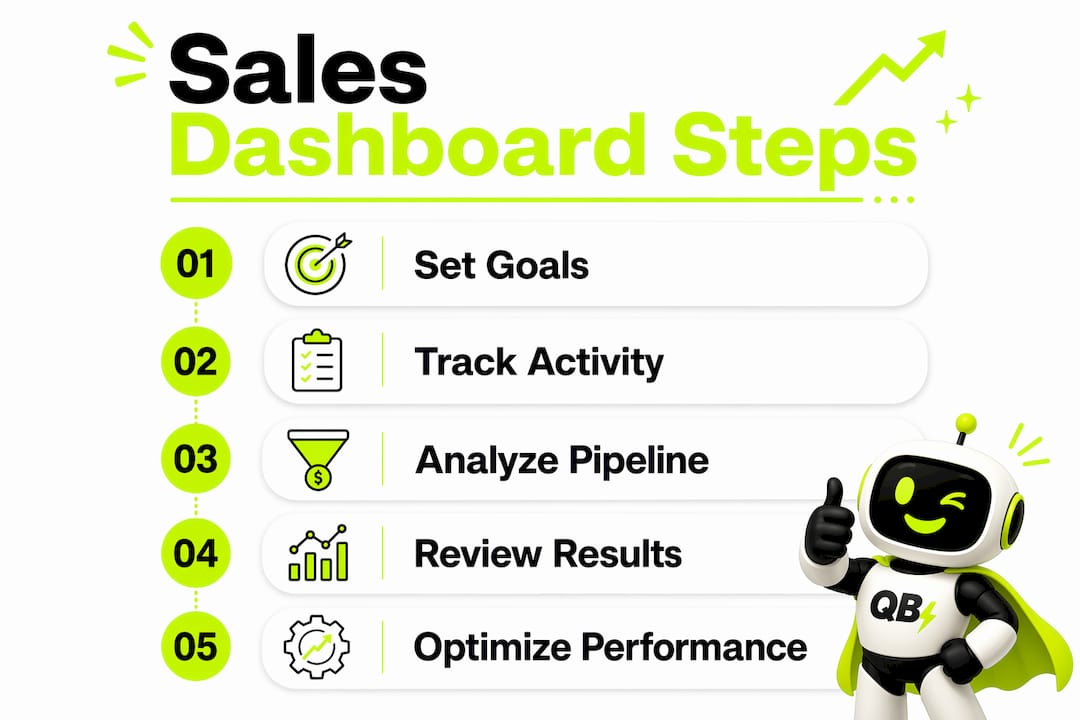
Define your top three to five goals. Revenue quota, meetings booked per week, and pipeline coverage ratio are common starting points. Every metric on your dashboard should tie directly to one of these goals.
-
Choose your KPIs and hide the rest. A common pitfall is metric overload; successful dashboards surface only the metrics tied to current goals and hide secondary stats. If a number does not change your behavior today, remove it.
-
Select your widgets and layout. Put quota attainment and closed-deal value in the top left, where eyes land first. Use progress bars for targets, ranked lists for opportunities, and simple counters for activity metrics.
-
Set up your sharing and display options. Run the dashboard on your personal screen for daily use. If your team uses a shared TV display, add a leaderboard view alongside your personal metrics.
-
Automate report delivery. Schedule a daily email snapshot or Slack notification so your numbers reach you even when you are not logged in.
-
Review and trim monthly. Goals shift. A metric that mattered in Q1 may be irrelevant in Q3. Revisit your dashboard at the start of each month and cut anything that no longer drives a decision.
Best practices for daily use of your rep dashboard
The dashboard only works if you actually look at it. Build a short morning routine around it.
- Start every day with a two-minute review. Check quota attainment, pipeline movement, and today's follow-up list before you open email.
- Watch for pipeline velocity shifts. If deals are sitting in one stage longer than usual, that is your signal to change the approach on those accounts, not to add more top-of-funnel activity.
- Use activity data for self-accountability. When your call count drops, your pipeline suffers two to three weeks later. The dashboard makes that lag visible before it becomes a quota problem.
- Combine your personal view with a team leaderboard. Embedding individual dashboards alongside team leaderboards creates healthy competition and keeps performance tracking consistent across the team.
- Update your CRM in real time. A dashboard is only as accurate as the data behind it. Log calls and update deal stages as they happen, not at the end of the day.
Pro Tip: Focus your daily review on metrics you can act on today. Quota attainment and pipeline stage distribution tell you what to do next. Win rate trends are useful weekly, not daily. Separate the two mentally to avoid analysis paralysis.
How AI-powered dashboards help you hit quota faster
AI turns a passive scoreboard into something closer to a co-pilot. Modern dashboards integrate AI-powered recommendations like suggested leads, deal risk alerts, and automated follow-ups, helping reps focus on high-impact work instead of deciding what to do next.
Key AI features worth knowing:
- Lead prioritization. AI scores your pipeline and surfaces the deals most likely to close this week, so you work the right accounts first.
- Deal risk alerts. When a deal goes quiet or a key stakeholder disengages, an AI alert fires before the deal slips off your forecast.
- Next-best-action prompts. Rather than a static call list, AI-driven dashboards suggest the specific action most likely to advance each deal.
- Automated follow-up drafts. AI writes the follow-up email after a meeting, cutting the time between conversation and next touch.
- CRM update automation. AI logs call summaries and updates deal fields, so your dashboard stays accurate without manual data entry.
Quotabuster packages all of these capabilities into a single platform built specifically for quota-carrying reps. Pipeline management, AI coaching, deal risk analysis, revenue forecasting, and CRM automation live in one dashboard instead of five separate tools.
Common pitfalls when using sales rep dashboards and how to fix them
Too many metrics. The most common mistake is adding every available KPI. A crowded dashboard creates noise, not clarity. Treat your dashboard like a cockpit: show only what you need to fly the plane right now, and hide everything else.
Stale data. A dashboard that reflects last week's CRM updates is worse than no dashboard because it creates false confidence. Set a personal rule to update deal stages and log activities in real time.
Tracking results without tracking activities. Revenue attainment tells you where you are. Activity metrics tell you why. Reps who only watch closed-deal numbers miss the early warning signs buried in call and email volume drops.
Ignoring trend lines. A single day's numbers mean little. A three-week downward trend in meetings booked is a real problem. Check weekly trends, not just today's snapshot.
Building it once and never revisiting. Your goals change every quarter. A dashboard built for a new-logo push looks different from one built for expansion selling. Audit your metrics at the start of each quarter and realign them to your current targets.
How to interpret dashboard data to improve your sales performance
Raw numbers tell you what happened. Interpretation tells you what to do about it.
Start with the gap between activity and results. If your call volume is high but meetings booked are low, your pitch or targeting needs work, not your effort. If meetings are strong but deals stall at proposal, the problem is in your demo or pricing conversation.
Compare your current period to the previous one. A drop in pipeline created this month predicts a revenue shortfall next month. Catching that pattern three weeks early gives you time to fix it. Catching it at month-end does not.
Look at conversion rates by stage, not just totals. A rep closing 30% of proposals is performing differently from one closing 10%, even if both have the same number of open deals. The dashboard makes that distinction visible without a manager having to point it out.
Finally, use your top-opportunities list as a daily action trigger. If a deal ranked in your top five has had no activity in seven days, that is today's first call. The dashboard should always be pointing you toward the next move.
Key Takeaways
A personal dashboard built around your actual goals, updated in real time, and reviewed daily is the single most reliable tool for self-managing your quota attainment.
| Point | Details |
|---|---|
| Real-time self-management | A sales rep dashboard shows pipeline, activity, and quota progress live, so you act without waiting for a manager's report. |
| Core KPIs to track | Calls made, emails sent, meetings booked, deals closed, revenue vs. quota, and conversion rate cover the essentials for most reps. |
| Avoid metric overload | Successful dashboards hide secondary stats and surface only metrics tied directly to current goals. |
| AI adds next-best-action | AI-powered dashboards suggest lead priorities, flag deal risks, and draft follow-ups, turning the dashboard into an active workflow tool. |
| Daily review drives results | Reviewing pipeline velocity and activity trends each morning lets you course-correct before a slow week becomes a missed quarter. |
Ready to turn your dashboard into a quota-busting machine? Quotabuster combines pipeline management, AI coaching, deal risk alerts, CRM automation, and revenue forecasting in one platform built for individual sales reps. No juggling five tools. Just one place to see everything and know exactly what to do next.